![[in]genios](http://images.squarespace-cdn.com/content/v1/51c861c1e4b0fb70e38c0a8a/48d2f465-eaf4-4dbc-a7ce-9e75312d5b47/logo+final+%28blanco+y+rojo%29+crop.png?format=1500w)
Alice H. Abboud Chalhoub & Cristal Matos Corporánv
Departamento de Contabilidad
Facultad de Administración de Empresas
Abstract:
Student loan debt in the United States has been increasing during the past decade and as of the first quarter of 2014 reached $1.11 trillion. Puerto Rico ranks #17 by total student debt among the states and territories. Nonetheless, students in Puerto Rico have an average of $18,000 loan, positioning it at the lowest rank by average debt per student. This pilot research attempts to understand the whys and wherefores of student debt in Puerto Rico. Therefore, the research question is do undergraduate students in Puerto Rico have debt and if so, are they using it for education or non-educational expenses? The two objectives are: (1) determine the characteristics of students with debt in Puerto Rico, and (2) discover the reasons and uses of debt expense. A sample of 194 (10%) of students from a School of Business at a public higher education institution of Puerto Rico was surveyed. The survey had 31 questions related to student loans and credit cards debt, debt expense categories (Likert scale), income, and demographics. Results indicate that 28% of business students have incurred in debt. This debt includes loans (24%), credit cards (44%), or both (31%). The research found no relationship between debt and academic performance. The majority (70%) of students with debt have a high GPA, and female students were more susceptible to have debt.
Keywords : undergraduate student debt, loans, credit cards, Puerto Rico
Resumen:
Durante la pasada década los préstamos estudiantiles han incrementado sustancialmente y para el primer trimestre del 2014 alcanzaron un total de $1.11 trillones. De acuerdo al total de deuda estudiantil, Puerto Rico ocupa el decimoséptimo lugar entre los Estados y territorios estadounidenses. Sin embargo, el promedio por estudiante es de $18,000, posicionándolo así como el más bajo entre todos. Por lo tanto, la pregunta de investigación es ¿los estudiantes subgraduados en Puerto Rico tienen deudas? y si la misma ¿se está utilizando para propósitos educativos o no educativos? Esta investigación piloto tiene como objetivo entender el propósito y la cantidad de deuda estudiantil en el que incurren los estudiantes. La muestra consta de 194 (10%) estudiantes de la escuela de Administración de Empresas de una institución pública de educación superior de Puerto Rico. Los participantes respondieron a un cuestionario de 31 preguntas sobre sus préstamos estudiantiles, tarjetas de crédito, categorías de gastos (siguiendo el modelo de escala Likert), ingresos y otras preguntas demográficas. Los resultados indican que 28% poseen deudas y que el son prestamos (24%), tarjetas de crédito (44%) o ambas (31%). La mayoría de los estudiantes (70%), tienen un alto GPA, y las mujeres fueron más susceptibles a tener deudas.
Palabras claves : préstamo estudiantil, tarjetas de crédito, Puerto Rico, estudiantes subgraduados
Introduction
Student debt in the United States has been quickly increasing during the last decade. According to the Federal Reserve Bank of New York, student debt in 2004 totaled $346 billion; whereas in 2012 was $996 billion, $1.08 trillion in 2013, and $1.11 trillion for the first quarter of 2014. Currently, student debt in the USA has surpassed credit card debt and economists consider it as the new bomb or financial crisis. On the other hand, credit cards are another alternative for students to incur in debt. Evidence from a survey made by the Montreal Bank, indicates that only 6% of college students use their credit card for educational expenses (Marketwire, 2012). In 2007, an average fourth year student in the USA has four credit cards and a $3,000 credit card debt (Cahill, 2007; Ludlum & Moskalionov, 2010).
Since March 2006, Puerto Rico is having an economic recession and all sectors of the population have been affected. Hence, the current government assigned $15,000,000 (of its 2014-2015 budget) as scholarships and grants to students of the University of Puerto Rico (UPR), which includes 11 campuses. Currently, the cost per credit at the UPR is $53. In contrast, private institutions average the cost per credit up to $205. This low cost per credit (compared with other institutions on the US) is an opportunity for students to pay for their education with mostly the support of the federal Pell Grant. According to the White House, report on US student debt by state, Puerto Rico ranks #17 by total debt. Nonetheless, students in Puerto Rico have an average of $18,000 of student debt, positioning it at the lowest rank by average debt (Refer to Appendix D, Table #4).
Recently, there have been some controversies regarding the use of student debt. For example, the well-known case of British student Katerina Christodoulou, who used a 10,000 pounds (equivalent to approximately $10,000) student loan in aesthetic surgery. (Mercury, 2014) Situations like this one have led financial institutions to stay alert to contractual violations.
The research question of this article is; do students in Puerto Rico have debt? If so, are they using it for education exclusively? Specifically, the research has two objectives: (1) determine the characteristics of students with debt in Puerto Rico, and (2) discover the reasons and uses of debt among the ones who do. Our research may serve as useful data for scholarship funds, federal lenders, financial institutions, local banks, and the university’s financial aid office, among others. These institutions can benefit by knowing this segment behavior, the new market trends, and the level of contractual violations to improve their services. It also contributes to the financial awareness literature including future taxation related research. Knowing the market behavior can be useful to understand the effect of monthly interests (related to student loan debt) when entirely deducted from the debtor’s income tax return. Statistical analysis can be helpful for the development of contributory reforms, and how relevant can result the deduction.
Review of the Literature
Student Loans
According to the 2014 First Quarterly Report on Household Debt and Credit of the Federal Reserve Bank of New York, student loan debt has reach $1.11 trillion as of March 31, 2014. As of that date, the student loan debt surpassed credit cards and auto loans. According to Stiglitz (2013), student loan debt might become the next crisis. Some argue (NACBA, 2012), that debtors will be 35 to 49 years old when they pay off their debt. On the other hand, authors such as Edmiston, Brooks, and Shelpelwich (2013) from the Federal Reserve Bank of Kansas indicate that student loan debts do not necessarily pose a substantial burden on society at large.
Student loans normally are part of Stafford Loans Federal Direct Loan Program (subsidized and unsubsidized loans), Federal PLUS Loans, or Federal Perkins Loan Program. The following table includes the total of subsidized and unsubsidized loans a student may borrow as an undergraduate, as of 2014:
|
Year |
Dependent Student (except students whose parents are unable to obtain PLUS Loans) |
Independent Students (and dependent undergraduate students whose parents are unable to obtain PLUS Loans) |
|
First Year Undergraduate Annual Loan Limit |
$5,000 – No more than $3,500 of this amount may be subsidized loans |
$9,500 – No more than $3,500 of this amount may be subsidized loans. |
|
Second Year Undergraduate Annual Loan Limit |
$6,500 – No more than $4,500 of this amount may be subsidized loans |
$10,500 – No more than $4,500 of this amount may be subsidized loans |
|
Third Year and Beyond Undergraduate Annual Loan Limit |
$7,500 – No more than $5,500 of this amount may be subsidized loans |
$12,500 – No more than $5,500 of this amount may be subsidized loans |
Source : Official Federal Student Aid Website (2014). https://studentaid.ed.gov/sa/
As of 2014, some institutions are part of the Perkins Loans in which payments are made directly to the school, has an interest rate of 5%, and funds depend on financial need and institution availability. Perkins limits loans up to $5,500 a year and a total of $27,500 as an undergraduate student. On the other hand, PLUS loans are granted to undergraduate parents have an interest rate between 6.41% and 7.21% depending on the issue date, and the amount is to be awarded by the U.S. Department of Education, according to the total cost of studying less any financial aid received. Under these federal loans terms, except for those unsubsidized, debtors pay interests after they graduate and the grace period following graduation has ended.
Credit rating agencies such as Fitch Ratings Agency, point to one third of the students commit delinquency[1] upon 30 days delay payments. Furthermore, according to the Federal Reserve Bank of New York (2014), 11% of aggregate student loan debt is 90 days or more delinquent or in default. According to Price (2004), students from lower-income are more likely to have debt burden[2] than those from higher income families. Furthermore, Price concludes that Black and Hispanic students are more likely to have debt burden than White students are. Other studies mentioned by Price indicate that the availability of guaranteed student loans increase the probability of college enrolment. On the other hand, Chen (2008) mentions that financially poor students are more positively influenced to persist by receiving grants; compared to higher-income students and working class students who were more negatively affected by inadequate loan and work-study aid. In terms of the influence on educative perseverance, research demonstrates that loans may be positive or negative in a student’s level of perseverance.
Credit Card Use
Credit cards have served as spending stimuli. Consequently, students spend more than they would without a credit card. (Feinberg, 1986; Robb & Pinto, 2010) Young adults, especially college students, are becoming an important target market segment for financial institutions. They have been characterized by their significant increase of purchasing power and brand, trends, image, and price awareness. An important factor is that this segment experience strong emotions during this life’s stage and poses weak inhibitions, making them more likely to pursue reckless and risky behaviors. (Chien-Wen, 2010) Statistics show that 91% of worldwide college seniors have at least one credit card and 56% are from the United States. The average amount owed in credit card and at the time of graduation is more than $2,800, and one out of five will have $10,000 or more. (Joireman, Kees, Sprott, 2010) These students argue that they use and need credit cards for benefits such as convenience payments, emergency resources, and starting a good credit history. (Fagerstrom, Hantula, 2013)
Robb & Pinto (2010) summarized the classification of college students as "financially at-risk" (FAR students) based on Lyons (2004) previous work. Lyons defines this concept referring to students that meet one or more of the following characteristics: (1) have credit card balances of $1,000 or more, (2) are delinquent on their credit card payments by two months or more, (3) have reached the limit on their credit cards, (4) pay off their credit card balances some of the time or never, (5) use the credit cards for instalment purchases, and (6) use their credit card for cash advances. The study identifies that FAR students are more likely to be financially independent, recipients of financial aid, female, black and Hispanic. Even though many of those students come from middle-income families (Robb & Pinto, 2010), it has also been found that those who have higher income have been associated with more irresponsible credit use. (Fagerstrom, Hantula, 2013) Many of those students have reported the use of financial aid money—scholarships, grants and students loans—to cover their personal debts. Furthermore, FAR students who hold loan debts, indicate that they would give priority to the repayment of credit card debt over student loan debt. (Robb & Pinto, 2010)
Previous work has also provided insights of the level of knowledge that FAR students have about personal finances. Results indicate that students with good financial knowledge, as well as those with less knowledge, have the same probability to have credit card problems. Moreover, students with higher levels of knowledge about finance—business students—had higher bad debt balances on credit cards lines. (Fagerstrom, Hantula, 2013)
There are two kinds of expenses that have been identified and that can be related to credit card use. First, college expenses (e.g., textbooks, school supplies, and commuting costs) and secondly, non-education necessity items (going out to restaurants and bars, vacations, fashion, electronics, and gifts). The top expenses purchased on credit cards based on amounts spent and frequencies were food, clothing and cosmetics. (Mae, 2009; Robb & Pinto, 2010) Others identified expenses covered with credit cards by FAR students are tuition, groceries, and auto expenses (Robb & Pinto, 2010). Some researchers attribute many of these behaviors to compulsive acts of shopping (defined by Fagerstrom & Hantula as inability to control choice), or as a repetitive form of primary response to negative events or feelings. (Joireman, Kees, Sprott, 2010) Likewise, literature point out those compulsive buyers tend to have higher levels of credit card debt. (Joireman, Kees, Sprott, 2010) This segment of young adults whom made impulsive choices, have also reported a greater use and abuse of cigarettes, alcohol, and marijuana. (Lai, 2010)
The incorrect use of credit card can have long-term life consequences in their financial status. (Robb & Pinto, 2010). Higher costs of borrowing, unnecessary fees, and the increase in credit card debt rates, might result in life quality consequences such as anxiety and poorer health. (Joireman, Kees, Sprott, 2010) Moreover, Bryant and Overymyer-Day (2013) indicate that students with debt problems react with dysfunctional behaviors such as drinking, drugs, depression, and eating. These behaviors affect academic life because sleep processes are disrupted and hangovers might lead the student to missing classes. As a result, students have low academic performance. (Ha, 2013)
Methodology
A questionnaire survey was conducted among undergraduate students registered in the College of Business Administration at the University of Puerto Rico, Río Piedras Campus. Participants completed a consent written form, informing about their general rights as participants in the research. The survey had 31 questions related to student loans and credit cards debt, debt expense categories (Likert scale), income, and demographics. The sample consists of 194 students selected randomly and which represent approximately 10% of the 2014-2015 Fall Semester body of undergraduates enrolled in the College of Business Administration.
The sample’s proportion is comparable to the College of Business Administration composition[3]; students of the sample are enrolled in a Business Administration curriculum and major in Accounting (46% of the sample), Marketing (18%), Human Resources (18%), Finance (11%), Office Administration (5%), Information Systems (5%), General Program (4%), Supply and Operations Management (2%), Economics (1%), and Statistics (1%). Refer to Appendix 1 for complete information of the sample demographics.
Variables
- GPA : Grade Point Average is a number representing the average value of the accumulated final grades earned in courses over time. Commonly known as GPA for its abbreviation, a student’s grade point average is calculated by adding up all accumulated final grades and dividing it by the number of grades awarded.
- Student loans : is a low-interest loan for students and parents, which is used to help, pay for the cost of any form of education higher than high school.
· Credit card: a card issued by a financial company giving the holder an option to borrow funds, usually at a point of sale. Credit cards charge interest and are primarily used for short-term financing.
- Non-academic expenses : non-education related items and expenses.
- Academic expenses : According to Higher Education Act of 1965 (HEA) amended in 2010, cost of attendance include tuition and fees, books and supplies, transportation, dependent care expenses, and disability-related expenses. This include; services, personal assistance, transportation, equipment and supplies related to the disability, loan fees, including origination and guarantee fees, cost of first professional credentials, miscellaneous personal expenses, personal computer, and room and board.
Results
A total of 54 students indicated they have debt. A 31% have both a student loan and credit card. A 24% have student loans and 44% have credit card. Students from the sample present the following financial knowledge characteristics. Only 14% have taken financial planning courses at the university. The majority work part-time and are between the ages of 19 and 21. Over half of them (58%) pay for their education with the Federal Pell Grant, followed by the use of savings (27%) and income from a part-time job (21%). Additionally, 129 out of 194 participants indicated they need additional income. The major purpose of needing this income is for food expenses (111), followed by car expenses (84), clothes and shoes (66), education (59), health care (52), computers or cellphones (51), entertainment (40), services (39), and others (43).
Regarding the counseling offered by the financial aid office, 90% of respondents have not received counseling, 8% have received counseling, but not useful and 2% has received useful counseling (Refer to Appendix B, Figure #3). Financial counseling deficiencies were also noted in other studies. On the other hand, 14% of students have taken financial planning courses at the university, while 48% have not, but plan to take it, and 38% have not, and do not plan to take it (Refer to Appendix B, Figure #4). Furthermore, students who have debt do not necessarily have a low GPA. The majority or a 70% of students with debt have a GPA average between 3.00 and 4.00 (on an average academic scale of 4.00 points). However, other data suggests that a greater proportion of females are more susceptible than males to have debts (mostly loans). According to our results, 60% of students with loan debt were female. When asked about which other expenses should be considered for financial aid, students indicated the following—in order of frequency—home and school, family care, home move, marriage, veterinary expenses, entertainment, and vacations.
Lastly, food, education and car expenses were the most frequent expense among students with debt. Nonetheless, considering the scale of frequency, students highly used their student loans for food, education and car expenses. Students with credit cards highly used the money for the same three purposes, and for clothes and entertainment.
Conclusion
Only a few students or 28% of the business school undergraduate students in the sample have student loans, credit cards, or both. The majority is not receiving financial aid counseling or has not taken a financial planning course. It is important to emphasize that our sample were business students, whom will be expected to get involved on financial counseling activities, and micro and macro aspects of economy because of the nature of their majors. This raises the question about the higher education institutions schools of business capacity of providing the necessary resources, to effectively education to a student in his financial life, because this effect and knowledge will influence the future market.
Top expenses covered by debt were food, education, car expenses, clothes, and entertainment. However, 6% indicated that have spent on controlled substances student loan money, and spent credit cards for aesthetic purposes, both with a scale of high spending amount and frequency. Money used from student loans for nonacademic purposes—going out to restaurants and bars, vacations, fashion, electronics, and gifts—implies contractual violations with financial, state and federal institutions.
According to literature and the results of this research, female tend to have more debt than males. Additionally, students also agree to spend their debt money mostly on food and automobile expenses. These two categories are considered as academic expenses according to Higher Education Act of 1965 (HEA). Therefore, higher education students incur mostly in debt for educational purposes. However, limitations of literature comparison arise from sample characteristics because of the educational expense difference between the USA and PR. Nonetheless, 129 students indicated that they need additional income and 59 need it to cover educational expenses. Future research could examine a comparison of the student debt realities affronted between the United States and Puerto Rico, to let examine the difference and meeting points. Also, can include expanding the sample to other public and private universities or higher education institutes across Puerto Rico, to enhance comparisons.
Conversely, limitations of literature comparison arise from sample characteristics because of the educational expense difference between the United States and Puerto Rico. Nonetheless, 129 students indicated that they need additional income and 59 need it to cover educational expenses. Future research could examine a comparison of the student debt realities affronted between the United States and Puerto Rico, to let examine the difference and meeting points. Also, can include expanding the sample to other public and private universities or higher education institutes across Puerto Rico, to enhance comparisons.
Appendixes
Appendix 1: Demographic information
Table #1: Sample demographics
|
|
||
|
Gender |
Amount |
Percentage |
|
Female |
101 |
53% |
|
Male |
91 |
47% |
|
Age |
||
|
18 years or less |
12 |
6% |
|
19 – 21 |
118 |
61% |
|
22 – 24 |
55 |
29% |
|
25 or more |
7 |
4% |
|
Civil status |
||
|
Single with children |
10 |
5% |
|
Single without children |
174 |
91% |
|
Married with children |
5 |
3% |
|
Married without children |
1 |
1% |
|
Prefer not to answer |
2 |
1% |
|
Year of study |
||
|
1st year |
9 |
5% |
|
2nd |
18 |
10% |
|
3rd |
41 |
22% |
|
4th |
64 |
35% |
|
5th or more |
53 |
29% |
|
Higher academic aspiration |
||
|
Bachelor's degree |
39 |
20% |
|
Master's |
81 |
42% |
|
Doctorate |
36 |
19% |
|
Juris Doctor |
30 |
16% |
|
Other |
6 |
3% |
|
Grade point average (Overall GPA) |
||
|
3.50 - 4.00 |
72 |
39% |
|
3.00 - 3.49 |
69 |
38% |
|
2.50 - 2.99 |
37 |
20% |
|
2.00 - 2.49 |
4 |
2% |
|
1.99 or less |
1 |
1% |
Figure #1: Students work load distribution

Figure #2: Student resources of educational funding

Appendix 2: Financial knowledge characteristics
Figure #3: Students receiving loan counseling from the financial aid office

Figure #4: Percentage of students taken financial planning courses at the university and usefulness

Appendix 3: Data analysis
Figure #5: Expense activity and comparison by type of debt. Horizontal axis represents frequency of expense scale.

Table #2: Student loans current debt amount according to home income.
|
Loans current principal debt |
|||||
|
None |
5,000 or less |
5,001-9,999 |
10,000-19,999 |
||
|
Home Income |
$25,000 or less |
50 |
6 |
4 |
0 |
|
25,001 - 50,000 |
52 |
10 |
3 |
1 |
|
|
50,001-100,000 |
36 |
3 |
1 |
1 |
|
|
More than 100,000 |
21 |
1 |
0 |
0 |
|
Table #3: Credit card current debt amount according to home income.
|
Credit card current debt |
||||||
|
None |
$0 - 300 |
301 - 500 |
501 - 1,000 |
1,001 - 5,000 |
||
|
Home Income |
$25,000 or less |
49 |
0 |
0 |
0 |
0 |
|
25,001 - 50,000 |
49 |
6 |
2 |
2 |
1 |
|
|
50,001-100,000 |
30 |
11 |
1 |
4 |
1 |
|
|
More than 100,000 |
20 |
2 |
0 |
0 |
0 |
|
Figure #6: Students receiving or not receiving federal grant and amount of credit card debt.
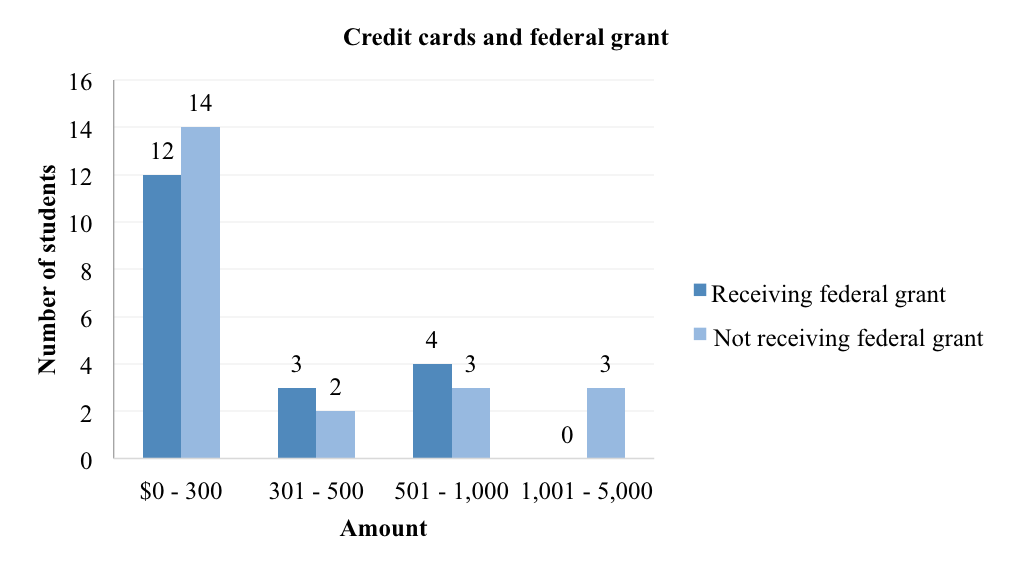
Figure #7: Students receiving or not receiving federal grant and amount of student loan debt.
Appendix 4: Current State-By-State Student Debt
Table #4: Data arranged from highest to smallest average amount debt per student .
|
State |
Total Number of Federal Student Loan Borrowers |
Total Outstanding Federal Student Loan Debt (in thousands) |
Average debt per student (in thousands) |
|
|
1 |
District of Columbia |
131,000 |
4,997,770 |
38.15 |
|
2 |
Other* |
93,000 |
2,782,869 |
29.92 |
|
3 |
Georgia |
1,352,000 |
39,325,631 |
29.09 |
|
4 |
Maryland |
776,000 |
21,710,281 |
27.98 |
|
5 |
South Carolina |
604,000 |
16,236,614 |
26.88 |
|
6 |
Virginia |
1,002,000 |
26,648,975 |
26.60 |
|
7 |
Florida |
2,334,000 |
61,761,711 |
26.46 |
|
8 |
Alabama |
575,000 |
15,155,514 |
26.36 |
|
9 |
Illinois |
1,795,000 |
47,195,889 |
26.29 |
|
10 |
Oregon |
561,000 |
14,715,958 |
26.23 |
|
11 |
New York |
2,825,000 |
73,198,472 |
25.91 |
|
12 |
Colorado |
761,000 |
19,583,486 |
25.73 |
|
13 |
Michigan |
1,529,000 |
39,329,986 |
25.72 |
|
14 |
California |
4,036,000 |
103,422,087 |
25.62 |
|
15 |
Missouri |
909,000 |
23,265,146 |
25.59 |
|
16 |
Tennessee |
793,000 |
20,258,649 |
25.55 |
|
17 |
Mississippi |
412,000 |
10,460,363 |
25.39 |
|
18 |
Vermont |
99,000 |
2,504,799 |
25.30 |
|
19 |
North Carolina |
1,056,000 |
26,622,674 |
25.21 |
|
20 |
Louisiana |
618,000 |
15,525,291 |
25.12 |
|
21 |
Massachusetts |
980,000 |
24,214,544 |
24.71 |
|
22 |
Pennsylvania |
2,065,000 |
50,476,342 |
24.44 |
|
23 |
New Jersey |
1,172,000 |
28,452,337 |
24.28 |
|
24 |
Ohio |
1,993,000 |
47,831,064 |
24.00 |
|
25 |
Kansas |
453,000 |
10,811,977 |
23.87 |
|
26 |
Arizona |
896,000 |
21,364,364 |
23.84 |
|
27 |
Indiana |
985,000 |
23,484,927 |
23.84 |
|
28 |
Hawaii |
129,000 |
3,073,287 |
23.82 |
|
29 |
Nevada |
262,000 |
6,218,418 |
23.73 |
|
30 |
Washington |
771,000 |
18,275,602 |
23.70 |
|
31 |
Iowa |
522,000 |
12,278,244 |
23.52 |
|
32 |
West Virginia |
242,000 |
5,686,231 |
23.50 |
|
33 |
Nebraska |
285,000 |
6,630,636 |
23.27 |
|
34 |
Oklahoma |
509,000 |
11,824,237 |
23.23 |
|
35 |
Arkansas |
357,000 |
8,281,905 |
23.20 |
|
36 |
Texas |
3,075,000 |
71,225,914 |
23.16 |
|
37 |
New Mexico |
240,000 |
5,552,558 |
23.14 |
|
38 |
Minnesota |
879,000 |
20,319,614 |
23.12 |
|
39 |
Connecticut |
508,000 |
11,724,735 |
23.08 |
|
40 |
Kentucky |
588,000 |
13,417,245 |
22.82 |
|
41 |
New Hampshire |
209,000 |
4,763,495 |
22.79 |
|
42 |
Idaho |
217,000 |
4,916,154 |
22.66 |
|
43 |
Delaware |
129,000 |
2,912,181 |
22.58 |
|
44 |
Wisconsin |
812,000 |
18,215,798 |
22.43 |
|
45 |
South Dakota |
135,000 |
3,021,525 |
22.38 |
|
46 |
Alaska |
66,000 |
1,474,105 |
22.33 |
|
47 |
Montana |
139,000 |
3,065,639 |
22.05 |
|
48 |
North Dakota |
110,000 |
2,395,522 |
21.78 |
|
49 |
Rhode Island |
160,000 |
3,477,388 |
21.73 |
|
50 |
Maine |
202,000 |
4,387,506 |
21.72 |
|
51 |
Utah |
303,000 |
6,544,036 |
21.60 |
|
52 |
Wyoming |
59,000 |
1,216,884 |
20.63 |
|
53 |
Puerto Rico |
332,000 |
5,986,832 |
18.03 |
Source : Cited in The Domestic Policy Council & The Council of Economic Activities. (2014). Taking Action: Higher Education and Student Debt. The White House. Original source: U.S. Department of Education, 2014.
Notes
[1] Delinquency means that a payment was not done on time or before the due date.
[2] Price (2004) defines debt burden as the proportion of monthly income used to service student loans.
[3] The overall composition of Business School at the 2014 Fall semester was the following: Accounting (43%), Marketing (13%), Human Resources (7%), Finance (10%), Office Administration (9%), Information Systems (5%), General Program (6%), Supply and Operations Management (13%), Economics (1%), and Statistics (1%). Only 14 students had a second major or were only taking courses from the School of Business at the time the survey was distributed.
References Cited
Cahill, T.P. Credit card caution. New England Journal of Higher Education. 2007, 22(2), 21-22. Digital http://files.eric.ed.gov/fulltext/EJ793933.pdf
Chen, R. Financial Aid and Student Dropout in Higher Education: A Heterogeneous Research Approach. Higher Education: Handbook of Theory and Research . 2008, Vol. 23, 209-239. Digital Retreived from: http://geekyartistlibrarian.pbworks.com/f/Zach_EDHE6520_Financial Aid and Student Dropout in HiEd.pdf http://link.springer.com/chapter/10.1007%2F978-1-4020-6959-8_7
Chiens-Wen, L. How Financial Attitudes and Practices Influence the impulsive Buying Behavior of College and University Student Social. Behavior & Personality: An International Journal. 2010, 38(3), 373-380. Digital https://www.sbp-journal.com/index.php/sbp/article/view/1985
Derek V. (2004). Educational Debt Burden among Student Borrowers: An Analysis of the Baccalaureate & Beyond Panel, 1997 Follow-Up. Research in Higher Education, SpringerStable. 45 (7), 701-737. Retrieved from: http://www.jstor.org/stable/40197390
Edmiston, Lara Brooks & Steven Shelpelwich. (2013). Student Loans: Overview and Issues (Update) . RWP #12-05. Kansas City: Federal Reserve Bank of Kansas City Research Working Papers. Digital https://www.kansascityfed.org/publicat/reswkpap/pdf/rwp%2012-05.pdf
Fagerstrom, A., & Hantula, D. A. But it Now and Pay it for it Later: An Experimental Study of Student Credit Card Use. Psychological Record , 2013, 63(2), 323-332. Digital http://www.researchgate.net/publication/258109895_Buy_it_Now_and_Pay_For_it_Later_An_Experimental_Study_of_Student_Credit_Card_Use
Federal Reserve Bank of New York. (2014). Quarterly Report on Household Debt and Credit . New York: Federal Reserve Bank of New York, Research and Statistics Group-Microeconomic Studies. Digital http://www.newyorkfed.org/householdcredit/2014-q1/data/pdf/HHDC_2014Q1.pdf
Feinberg, R. A. (1986). Credit Cards as Spending Facilitating Stimuli: A Conditioning Interpretation. Journal of Consumer Research, 13(3), 348-356. Digital http://www.jstor.org/stable/2489426 https://www.uni-muenster.de/imperia/md/content/psyifp/aeechterhoff/wintersemester2011-12/vorlesungkommperskonflikt/feinberg_credcards_jouconres1986.pdf
Joireman, J., Kees, J., & Sprott, D. (2010). Concern with Immediate Consequences Magnifies the Impact of Compulsive Buying Tendencies on College Students' Credit Card Debt. Journal of Consumer Affairs, 44(1), 155-178. http://onlinelibrary.wiley.com/doi/10.1111/j.1745-6606.2010.01161.x/abstract
Ha, H. Credit Card Use and Debt by Female Students: A Case Study in Melbourne, Australia. Youth Studies Australia, 2013, 32(4), 57. Digital http://acys.info/documents/36/07_Ha_v32n4_2013.pdf.
Hogan, E. A., Bryant, S. K., & Overymyer-Day L. E. Relationship between College Students’ Credit Card Debt, Undesirable Academic Behaviors and Cognitions and Academic Performance. College Student Journal. 2013, 47(1), 102-112. Digital http://connection.ebscohost.com/c/articles/92757389/relationships-between-college-students-credit-card-debt-undesirable-academic-behaviors-cognitions-academic-performance
Joireman, J., Kees, J., & Sprott , D. Concern with Immediate Consequences Magnifies the Impact of Compulsive Buying Tendencies on College Students' Credit Card Debt. Journal of Consumer Affairs. 2010, 44(1), 155-178. Digital http://onlinelibrary.wiley.com/doi/10.1111/j.1745-6606.2010.01161.x/abstract
Lai, C.W. (2010). How Financial Attitudes and Practices Influence the Impulsive Buying Behavior of College and University Students. Social Behavior and Personality: an International Journal, 2010, 38(3), 373-380. Digital https://www.sbp-journal.com/index.php/sbp/article/view/1985
Ludlum, M., & Moskalionov, S. Student Use and Abuse of Credit Cards in Russia. Allied Academies International Conference. Proceeding of The Academy for Studies in International Business (ASIB), 2010, 10(1), 37-42. Print
Lyons, A. C. A Profile of Financially At-Risk College Students. The Journal of Consumer Affairs. 2004, 38(1), 56-80. Digital http://www.usc.edu/dept/chepa/IDApays/publications/A_profile.pdf
Moskalionov, S., & Ludlum, M. Student Use and Abuse of Credit Cards in Russia. Mustang Journal of Business and Ethics, 2010, 1, 67-74. Digital http://connection.ebscohost.com/c/articles/61070018/student-use-abuse-credit-cards-russia
Murdock, T. A. It Isn’t Just Money: The Effects of Financial Aid on Student Persistence. The Review of Higher Education Autumn. 1987, 11 (1), 75-101. Digital http://www.researchgate.net/publication/234720791_It_Isn't_Just_Money_The_Effects_of_Financial_Aid_on_Student_Persistence
Price, D. Educational Debt Burden among Student Borrowers: An Analysis of the Baccalaureate & Beyond Panel, 1997 Follow-Up. Journal of the Association for Institutional Research. 45 ( 7), 2004, 701-737. Digital http://link.springer.com/article/10.1023%2FB%3ARIHE.0000044228.54798.4c http://www.researchgate.net/publication/238355056_Educational_Debt_Burden_Among_Student_Borrowers_An_Analysis_of_the_Baccalaureate__Beyond_Panel_1997_Follow-Up
Robb, C. A., & Pinto, M. B. (2010). College Students and Credit Card Use: An Analysis of Financially at-risk Students. College Student Journal. 2010, 44(4), 823. Digital http://connection.ebscohost.com/c/articles/58002450/college-students-credit-card-use-analysis-financially-at-risk-students
Other sources of information, references, and periodical news
Frizell, S. (2014). Student Loans Are Ruining Your Life. Now They're Ruining the Economy, Too. TIME. (2014, February 26). Digital http://time.com/10577/student-loans-are-ruining-your-life-now-theyre-ruining-the-economy-too/
Howes, C. Student Loans: The Dark Side of “Good” Debt. New York: Barclays, 2012.
Marketwired L.P. Students Demonstrating Restraint with Credit Card Use- BMO 2012 Student Survey . 2012. Retrieved from http://www.marketwired.com/press-release/students-demonstrating-restraint-with-credit-card-use-bmo-2012-student-survey-tsx-bmo-1719689.htm
Mercury L. 'I Spent Pounds 10k Student Loan on Beauty Treatment'. 2014 Retrieved from http://search.proquest.com/docview/1537395026?accountid=44825
Sallie Mae. How undergraduate students use credit cards. Sallie Mae's National Study of Usage Rates and Trends. 2009. Retrieved January 10, 2010 from http://www.salliemae.com/about/news_info/research/credit_card_study/
Stiglitz, J. Student Debt and the Crushing of the American Dream. The New York Times. 2013, (May 12, 2013). The Opinion Pages-Opinionator. Retrieved from: http://opinionator.blogs.nytimes.com/2013/05/12/student-debt-and-the-crushing-of-the-american-dream/?_r=0
The Domestic Policy Council & The Council of Economic Activities. Taking Action: Higher Education and Student Debt. The White House . 2014. Retrieved from: http://www.whitehouse.gov/sites/default/files/docs/student_debt_report_final.pdf
The Project on Student Debt. Private loans: Facts and Trends. 2011 (July). Retrieved September 28, 2012 from http://projectonstudentdebt.org/
The Student Loan “Debt Bomb”: America’s Next Mortgage-Style Economic Crisis? National Association of Consumer Bankruptcy Attorneys (NACBA), February 7, 2012
Woman spent her pounds 10,000 Student Loan on Cosmetic Surgery. 2014, Jun 19. Leicester Mercury. http://www.leicestermercury.co.uk/Katerina-Christodoulou/story-21256101-detail/story.html
Revista [IN]Genios, Volumen 2, Número 1 (septiembre, 2015).
ISSN#: 2324-2747
Universidad de Puerto Rico, Río Piedras
© 2015, Copyright. Todos los derechos están reservados.